


The CS2 net graph is one of the most powerful tools for diagnosing performance and connection issues in Counter-Strike 2. Unlike CS:GO, the feature works differently in CS2, and many players still don’t know how to properly enable the new overlay or how to use the updated telemetry commands.
This guide explains everything:
• how to enable the CS2 net graph
• every useful net graph and telemetry command
• how to interpret FPS, ping, packet loss, and variance
• how to use the net graph to fix performance problems
• recommended settings and troubleshooting
If you’re optimizing your setup, guides like CS2 raw input, CS2 launch options or Show FPS in CS2 work well alongside this one.
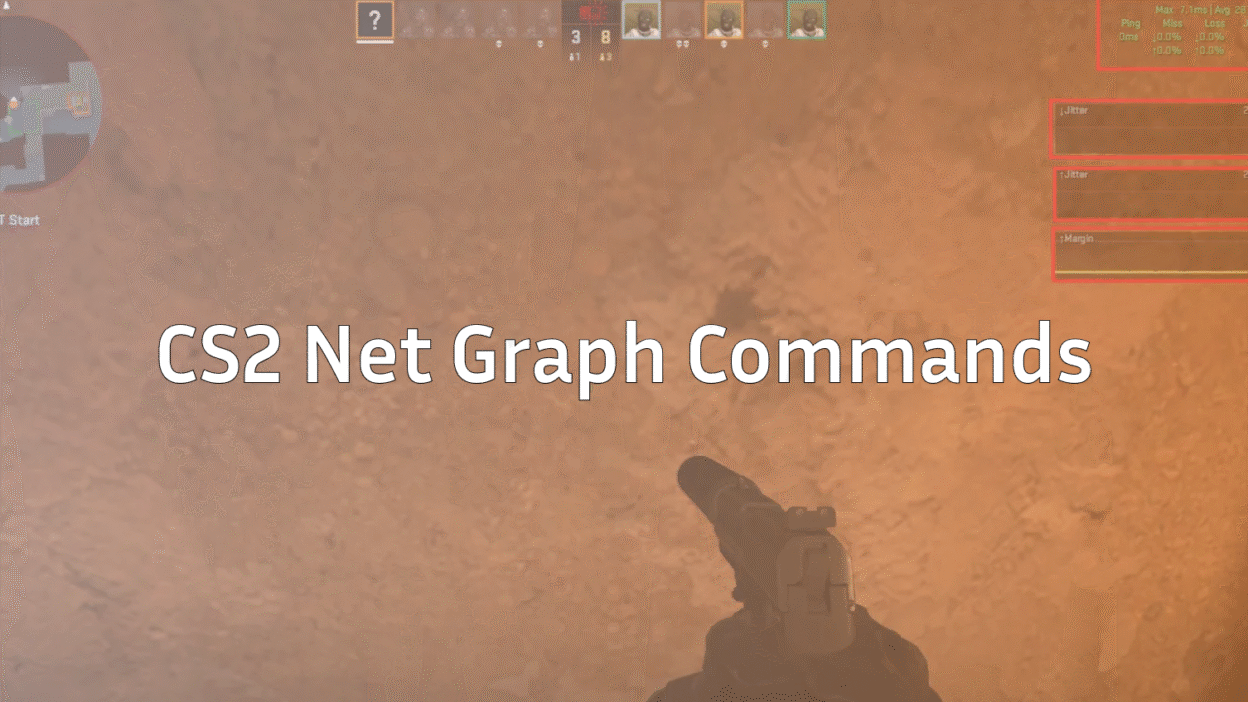
What Is the CS2 Net Graph?
The CS2 net graph is an on-screen diagnostic overlay displaying real-time performance and network metrics. This tool helps you see why something feels off in-game, whether it’s lag, stutters, bad peeks, or inconsistent hit registration.
It helps identify:
• FPS stability
• frame time consistency
• latency (ping)
• packet loss
• network misdelivery
• server variance
• simulation timing
• choke
If you’re struggling with movement stutters or delayed peeks, the guides on CS2 rubberbanding and how to fix packet loss in CS2 pair perfectly with the net graph.
How to Enable the Net Graph in CS2
There are two ways to activate the net graph in Counter-Strike 2.
Method 1: Enable It in Settings
- Open Settings
- Go to the Game tab
- Scroll until you find HUD options
- Locate “Show FPS Counter”
- Change it to “Graph”
This enables the updated CS2 performance graph.
Method 2: Enable It With Console Commands
Use the new CS2 telemetry command:
cq_netgraph 1
To disable:
cq_netgraph 0
For more detailed stats, you can enable additional telemetry:
cl_hud_telemetry_ping_show 1
cl_hud_telemetry_frametime_show 1
cl_hud_telemetry_servervar_show 1
cq_show_graph_stats 1
cq_show_build_info 1
These commands provide detailed performance data similar to the old CS:GO net graph but with additional depth.
Full List of CS2 Net Graph Commands
Display Commands
cq_netgraph 1
cq_netgraph 0
cl_showfps 1
cl_showfps 2
cl_showpos 1
cl_showpos 0
Telemetry Commands
cl_hud_telemetry_ping_show 1
cl_hud_telemetry_ping_show 0
cl_hud_telemetry_frametime_show 1
cl_hud_telemetry_frametime_show 0
cl_hud_telemetry_net_misdelivery_show 1
cl_hud_telemetry_net_misdelivery_show 0
cl_hud_telemetry_servervar_show 1
cl_hud_telemetry_servervar_show 0
cq_show_graph_stats 1
cq_show_graph_stats 0
cq_show_build_info 1
cq_show_build_info 0
What Each Net Graph Metric Means
Understanding what the values represent makes troubleshooting much easier.
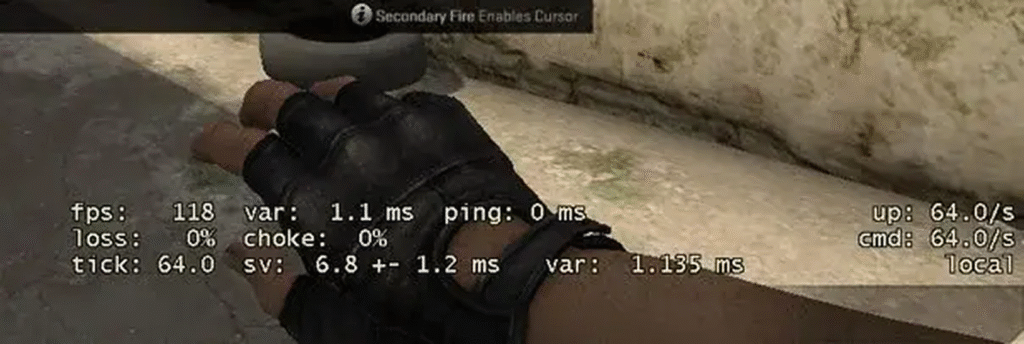
FPS (Frames Per Second)
FPS shows how many frames your PC renders every second. Low or unstable FPS affects aiming, recoil control, and responsiveness.
For optimization, see:
• CS2 launch options
• How to change viewmodel in CS2
Ping (Latency)
Ping shows your delay to the server.
• 0–40 ms is ideal
• 40–80 ms is passable
• above 80 ms causes delayed peeks and poor trades
If your ping spikes frequently, you may need CS2 port forwarding or packet loss troubleshooting.
Loss
Packet loss means your PC is not receiving data from the server.
• causes delayed shots
• causes hit registration issues
• feels like desync or ghost peeks
Related guide: how to fix packet loss in CS2
Choke
Choke indicates the server cannot send enough data to you. This can mimic the effects of packet loss.
Server Variance (sv)
Server variance shows how stable the server is. High variance often feels like slow peeks or odd movement by enemies.
Frame Time
Frame time measures how consistent your frames are. Even with high FPS, inconsistent frame times cause micro-stutters.
Enable with:
cl_hud_telemetry_frametime_show 1
Recommended Net Graph Configuration
This setup gives you all the important information without clutter.
cq_netgraph 1
cl_hud_telemetry_ping_show 1
cl_hud_telemetry_frametime_show 1
cl_hud_telemetry_servervar_show 1
cq_show_graph_stats 1
This is useful when working on improvement guides such as CS2 practice commands or analyzing performance on new maps like CS2 Mirage callouts, Inferno, Nuke, or Vertigo.
How to Toggle the Net Graph With a Keybind
Use this command to toggle net graph visibility:
bind “N” “toggle cq_netgraph 1 0”
Replace “N” with any key.
How to Use the Net Graph to Diagnose Problems
1. FPS Drops
Unstable FPS usually means you need to adjust settings or optimize your config.
Helpful: CS2 launch options
2. Ping Spikes
Usually caused by:
• Wi-Fi instability
• ISP issues
• background apps
• router congestion
See: how to fix packet loss in CS2
3. Rubberbanding
Rubberbanding is directly related to either packet loss or choke.
See: CS2 rubberbanding
4. Delayed Peeks or Bad Trades
If your peeks feel slow or enemies see you first:
• check ping stability
• check frame time
• check server variance
Advanced networking settings: CS2 interp settings
Net Graph Not Showing in CS2 (Fixes)
Step 1: Enable Console
Settings > Game > Enable Developer Console
Step 2: Reapply Command
cq_netgraph 1
Step 3: Reload the HUD
hud_reloadscheme
Step 4: Verify Game Files
If issues persist, see:
• CS2 missing executable fix
• CS2 won’t launch fix
When You Should Use the Net Graph
Players often rely on the net graph during:
• replay analysis (see CS2 replay commands)
• smoke practice (CS2 smoke practice commands)
• utility lineups
• community servers (CS2 community servers guide)
• Premier ranking sessions (CS2 ranks)
Final Thoughts
The CS2 net graph is essential for diagnosing issues related to FPS, latency, packet delivery, and overall performance. Once you understand how to read the metrics, you can quickly identify why your game feels inconsistent and fix it efficiently.If you want to improve your gameplay further, consider these guides:
• How to get better at CS2
• CS2 pro settings
• Show FPS in CS2
• CS2 tick rate explained