How to Show FPS in CS2: The Ultimate Performance Monitoring Guide
Wondering why your gameplay feels choppy despite a powerful rig? Or if your shots are missing due to lag, you can’t even see? You’re not alone. In the precision-driven world of Counter-Strike 2, your frames per second (FPS) is more than just a number—it’s the direct link between your intention and your in-game action. A low or unstable FPS can cause input lag, visual stuttering, and a significant peeker’s advantage for your opponents. Simply put, if you’re not monitoring your performance, you’re playing at a disadvantage. This guide will not only show you how to display your FPS in CS2 but will teach you how to interpret the data and use it to achieve buttery-smooth, competitive gameplay.
Why Monitoring Your FPS in CS2 is Non-Negotiable
FPS represents how many unique images your graphics card renders and your monitor displays each second. A higher, stable FPS is paramount for several reasons:
- Reduced Input Lag: Your actions (mouse movement, clicks) are reflected on-screen faster.
- Smoother Visuals: Eliminates stutter and tear, making tracking enemies and quick flicks easier.
- Competitive Edge: CS2’s sub-tick architecture aims for precise gameplay, but it still benefits immensely from high frame rates for optimal responsiveness.
Understanding your hardware performance through an FPS counter is the first step in diagnosing issues, from rubberbanding to perceived hit registration problems.
Method 1: How to Show FPS Using the In-Game Settings Menu (Easiest)
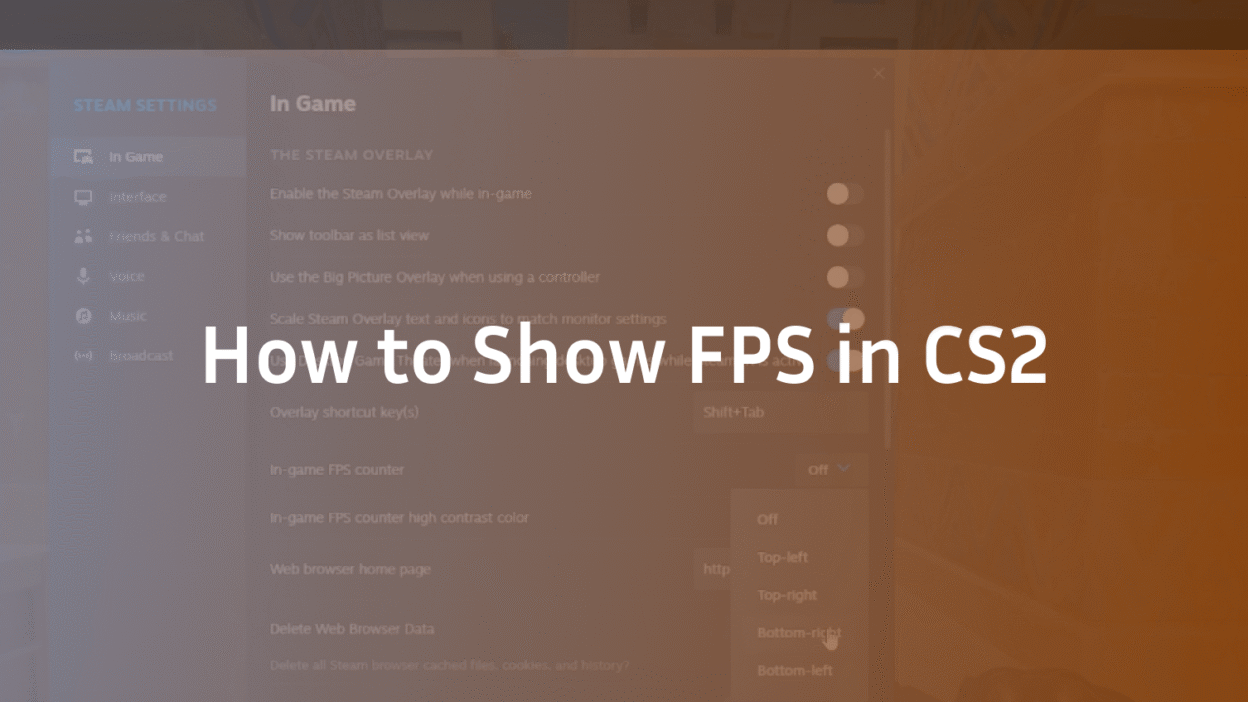
For players who prefer not to use the developer console, Valve provides a straightforward option within the settings.
- Launch CS2 and navigate to the main menu.
- Click on the gear icon to open Settings.
- Select the Game tab from the left-hand menu.
- Locate the “HUD Options” section.
- Find the setting “Enable FPS Counter” and click the dropdown menu.
- Choose your preferred position for the counter: Top-Left, Top-Right, Bottom-Left, or Bottom-Right.
- Close the settings menu. Your FPS will now be displayed in the chosen corner in a clean, minimalist format.
This method is perfect for a quick, always-on visual reference with zero setup.
Method 2: How to Show FPS Using the Console Command (Advanced Data)
For players who want more detailed statistics, the developer console is the only way to go. This method unlocks the powerful net_graph command, providing a wealth of data beyond just FPS.
Step 1: Enabling the Developer Console
Before you can use any commands, you must enable the console.
- Go to Settings > Game.
- Under the “Game” section, find “Enable Developer Console (~)“.
- Set the dropdown to “Yes“.
- You can now open the console in-game by pressing the ~ key (usually located below the ESC key).
Step 2: Using the cl_showfps Command
The most direct equivalent to the settings method is the cl_showfps command.
- Open the console.
- Type cl_showfps 1 and press Enter. To hide it, type cl_showfps 0. This command shows your FPS, but also adds a frame time graph (a bar that spikes with frame time inconsistencies) and a variance number. Lower frame time is better.
Step 3: Unleashing the Net_Graph for Maximum Data
For a true performance dashboard, net_graph is the ultimate tool. It provides a holistic view of your server/client operation.
- Open the console.
- Type net_graph 1 and press Enter. You will now see an overlay at the bottom of your screen with multiple lines of data. To adjust its position, use net_graphpos 0/1/2 (for left, center, right). To change the HUD layout scale, use net_graphproportionalfont 0 for a smaller, less obtrusive display.
Decoding Your Net_Graph: What All Those Numbers Mean
Simply showing the data isn’t enough. Expertise lies in interpretation. Here’s what each metric means:
- FPS: Your frames per second. Aim for a stable value at least equal to your monitor’s refresh rate.
- Var: Short for variance. Measures consistency in frame times. Keep this number as low as possible (ideally below 0.5). High var indicates stutter.
- Ping: Your latency to the game server in milliseconds (ms). Lower is better.
- Loss: Packet loss from client to server. It should always be 0%. If not, check your network.
- Choke: Packet loss from server to client. It should always be 0%.
- Tick: The server’s tick rate. In Premier mode, this is 64.
- Up / Cmd: Your cl_updaterate and cl_cmdrate. These should match the server’s tick rate (64 for MM/Premier).
If your net_graph shows high loss or choke, it might be time to look into solutions like CS2 port forwarding to ensure a clean connection.
Advanced Customization and Troubleshooting
Changing the FPS Counter Color
The in-game FPS counter color is fixed. However, the net_graph text color can be changed via console commands, allowing for a high-contrast color that’s easier to see. This requires more advanced console editing.
My FPS Counter or Net_Graph Disappeared!
If your overlay vanishes after a round ends or a map change, you can create a simple auto-exec config file to ensure it always reactivates. This is part of mastering CS2 settings for a consistent experience.
The Performance Impact of Net_Graph
A common question is whether net_graph affects FPS. The impact is negligible on modern systems—often a loss of 1-3 FPS at most. The benefit of the data far outweighs the minimal performance impact.
Beyond the Counter: How to Actually Improve Your FPS in CS2
Seeing a low FPS number is only step one. Here’s how to improve it:
- Video Settings: Lowering settings like Shadow Quality and Particle Detail can grant significant FPS boosts. Consider disabling anti-aliasing for a competitive edge.
- Launch Options: Use performance-focused launch options like -high (set process priority to High) and -threads [number] (specify CPU core usage).
- In-Game Commands: Commands like fps_max 0 (removes the FPS cap) or fps_max 400 (caps it to a high value) can help. Some players also use commands like r_drawparticles 0 to disable certain effects, though this is not recommended for competitive play as it removes important visual information like smoke edges.
- PC Optimization: Ensure no background applications are hogging your CPU/GPU power. Update your graphics drivers.
Conclusion: Knowledge is Power
Monitoring your FPS is a fundamental practice for any serious CS2 player. It transforms subjective feelings of “lag” into objective, actionable data. Whether you use the simple in-game FPS counter or the powerful net_graph overlay, you are equipping yourself with the knowledge to diagnose problems, validate your settings, and ultimately, create a smoother and more responsive gaming experience. Now that you know how to show FPS in CS2, put that knowledge into practice, fine-tune your setup, and climb those CS2 ranks.
Ready to master your setup? Import the configs of the pros with our guides to s1mple’s CS2 settings or ZywOo’s CS2 settings and see how your FPS handles the best configurations in the world.
FAQ Section
Q: What is a good FPS to aim for in CS2?
A: For a truly competitive experience, you should aim for a stable FPS that is at least double your monitor’s refresh rate. For a 144Hz monitor, target 288+ FPS. This ensures that even during graphically intense moments (smokes, mollies), your FPS stays high enough to maintain smoothness and minimal input lag.
Q: Can I show FPS in CS2 without the console?
A: Absolutely. As detailed in Method 1, you can enable a clean FPS counter directly in the Game Settings menu under “HUD Options” without ever needing to open the developer console.
Q: Does net_graph lower my FPS?
A: The performance impact of enabling net_graph is extremely minimal, typically resulting in a loss of 1-3 FPS on most systems. The invaluable performance data it provides far outweighs this tiny cost.
Q: What does VAR mean on the CS2 FPS counter?
A: VAR (variance) is a measure of how consistent your frame times are. A high or spiking VAR value indicates stuttering and instability, even if your average FPS seems high. For the smoothest gameplay, you want your VAR to be as low and stable as possible, ideally below 0.5.
Q: How do I move the net_graph position in CS2?
A: Use the console command net_graphpos [0/1/2]. 0 positions the graph on the left side of the screen, 1 in the center, and 2 on the right. You can also use net_graphproportionalfont 0 to make the text smaller and less obtrusive.